In this blog article I would like to share with you how to embed a dashboard in a Crystal Report using flash variables. First of all let’s give a scenario that leads us to do that. In this case we wanted to create a dashboard for a SAP GRC module. The problem was that we could not connect to the system directly with SAP BusinessObjects Dashboards (Xcelsius for the most nostalgic ones). Apart from that, there is a good thing about having a dashboard embedded in Crystal, you will have a dashboard that can be refreshed from Crystal Reports without needing a previous authentication. You will also be able to save the “report” (you can show the dashboard) in PDF with saved data and the dashboard will be completely clickable and navigable.
After having a clear reason why we need to embed the dashboard into a Crystal Report let's jump to how to do it.
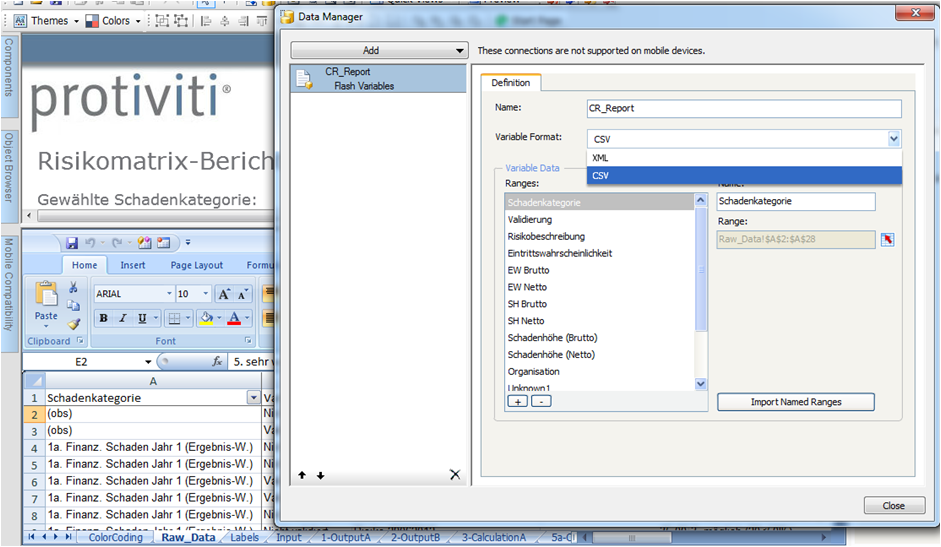
Once you have your dashboard ready go to “Manage Connections” and add a new one by choosing “Flash Variables”.
Once you have it ready give a name to this connection and choose the variable format as CSV. Now you might wondering why that is.
The variable format indicates how you have to prepare the data in Crystal Reports in order to let Excel read the variables, by putting them into the specific columns.
Virtually, what more or less happens between the dashboard embedded and the data from the Crystal report is the following:
For the moment we will step forward and later we will get back to this topic again.
Continuing with the Flash variable connection we were working at. Create as many variables as you need in you Dashboard. In the example below we have one flash variable for each column of the raw data table (see the image below).
Finally, save the dashboard and export it to flash file.
After those steps in SAP Dashboards, open Crystal Reports and open the report in which you want to add the Dashboard (it needs to have data inside).
Right click on the place you want to locate the dashboard and choose “Insert Flash Object”. A window will be opened and you will be able to select your flash file and select if you want it linked or embedded. If you want to have it connected to the Crystal data choose “Embedded”.
Once the dashboard is embedded you need to create the variables which will be linked with the flash variables in the Excel file. This is the time to go back to our figure 2! As we said the format you need to send the data to the flash variables is CSV; that means you should cook your data stored in columns (objects in your crystal reports) in order to have it in a singles string with values separated by comas.
Now here is the trick to creating these variables so that you can avoid fighting with Crystal reports for a while.
Take each column or data you need and type for each one of them the following formula:
global stringvar [Varriable];
if ([Variable]="") then [Variable]:=Cstr()
Else [Variable]:=[Variable]+","+Cstr();
[Variable];
Note: Be careful if the data to convert into CSV is number formatted as #,##.##. The thousand separator will create errors in your dashboard if you are showing them. To avoid that kind of issues replace Cstr() by Cstr(,’#’).
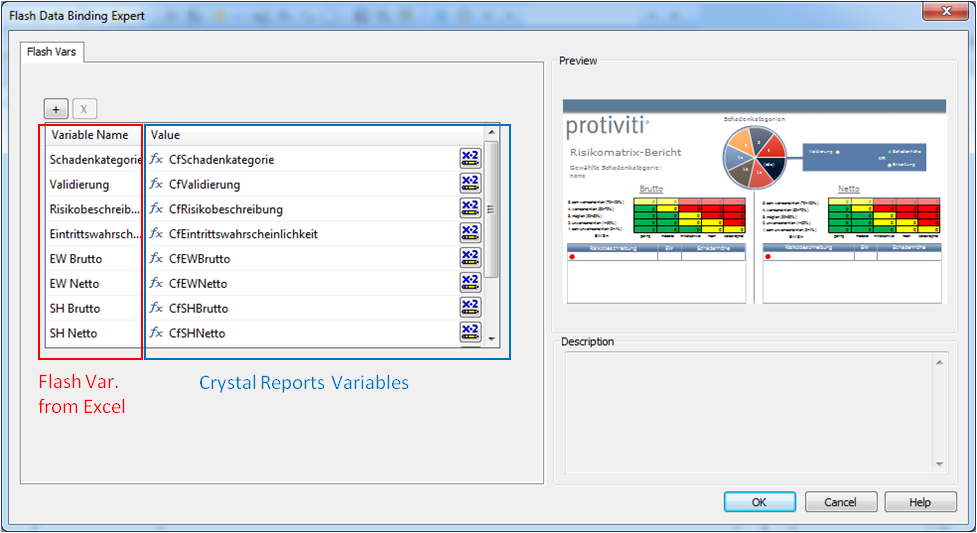
Now that you have the dashboard placed and the variables created in Crystal reports, right click on the dashboard (in design mode) and choose “Flash Data Export”.
Once the pane is open you will insert the name of the Excel flash variables in the left column and the Crystal Reports variables in the right column. Is VERY important that the names of the variables in the left columns match perfectly (exactly the same name) with the names of the variables defined in the data manager in SAP Dashboards (see figure 1).
By following these steps you will be able to add a Dashboard into a Crystal reports and what is better is that you will be able to refresh a dashboard that is reading data from you system without any logging needed!
I hope this is useful to you in your upcoming projects. If you have any tips our doubts, leave a comment below.


