
Machine Learning and Artificial Intelligence are often used interchangeable (synonyms), but they aren’t. Let’s see first how they relate to each other.
What is Artificial Intelligence?
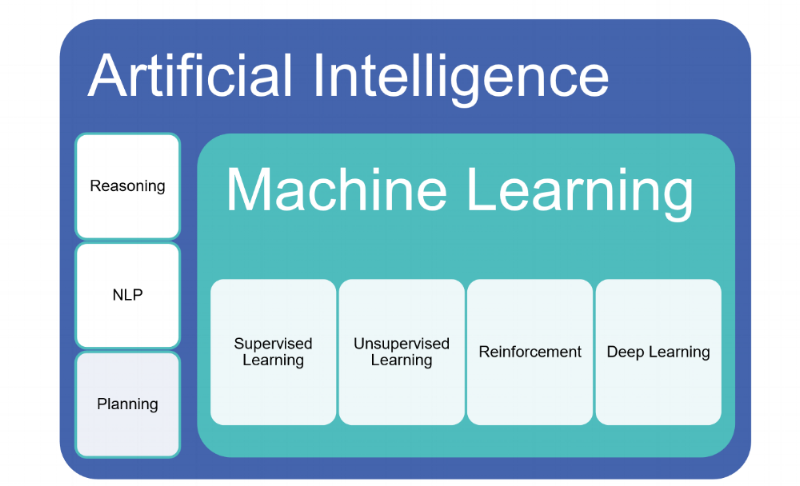
A.I. is the science of training machines to perform human tasks. A.I. holds a concept that a computer can act like a human brain calculating the road around us every second of every day. Artificial Intelligence includes reasoning, cognitive processing, natural language recognition, planning and other research fields in addition to Machine Learning.

What is Machine Learning?
ML is a specific subset of AI that trains machines how to learn.
The name machine learning was introduced by Arthur Samuel in 1959. It is a field of science that explores the development of algorithms that can learn from and make predictions on data. The main difference with other common algorithms is the ‘learning’ piece. Machine Learning algorithms are not series of processes serially executed to produce a predefined output. They are instead series of processes aiming to ‘learn’ patterns from past events and build functions that can produce good predictions, within a degree of confidence.
Within the field of data analytics, machine learning is part of a piece known as predictive analytics.
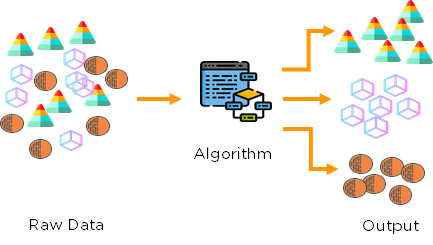
ML models look for patterns in data and try to draw conclusions like people would. Once the algorithm gets really good at drawing the right conclusions, it applies that knowledge to new sets of data.
Machine Learning application cycle:

What does it need to perform well?
Granular data
Large volumes of data
Extremely diverse data
The four types of Machine Learning
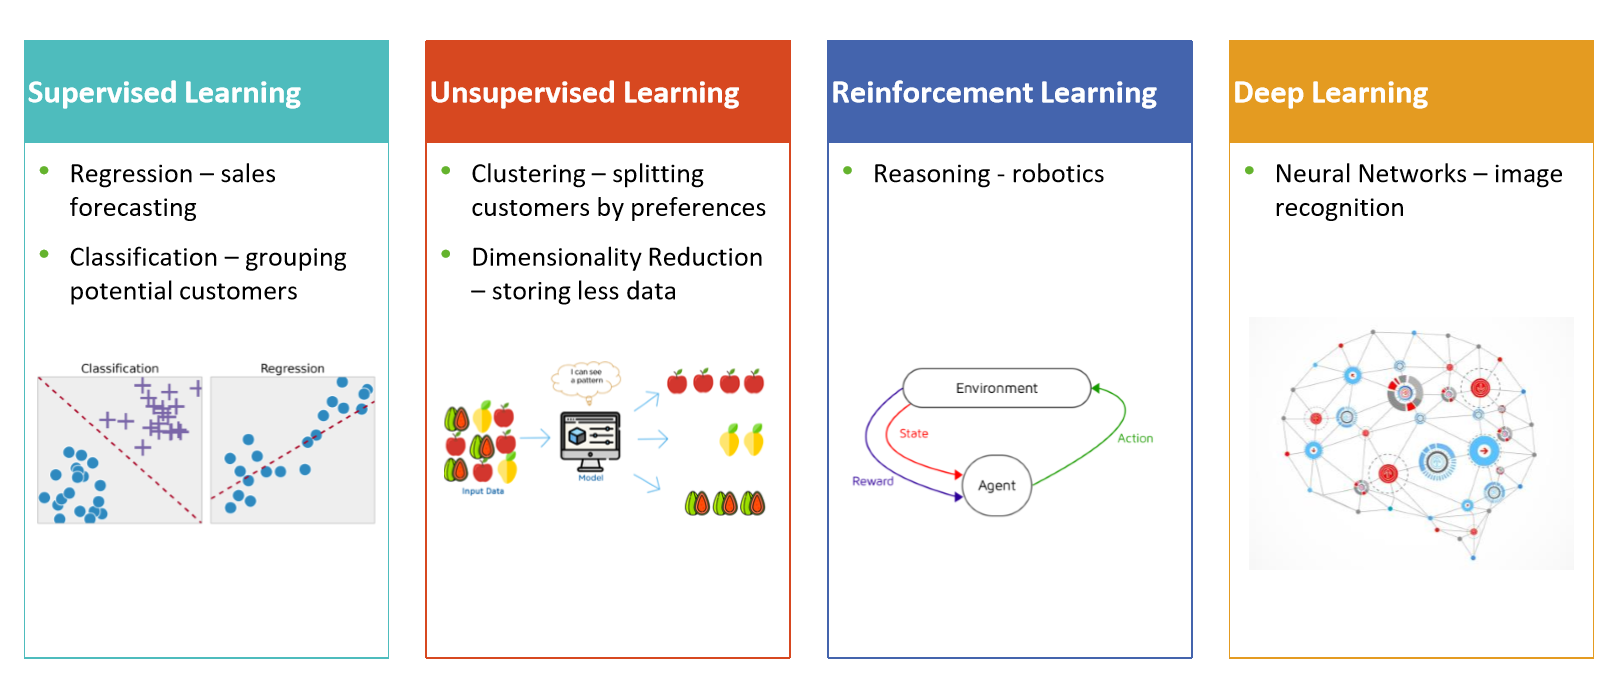
SUPERVISED MACHINE LEARNING
It is composed of algorithms that try to find relationships and dependencies between a target output we want to predict – ranging from churn to insurance fraud or potential success of a sales promotion on different individuals - and data we have from other individuals from the past, including demographic characteristics or previous behavioural data. We use this past data as input variables to predict the most probable output value for new data, based on those relationships learned from previous data sets.

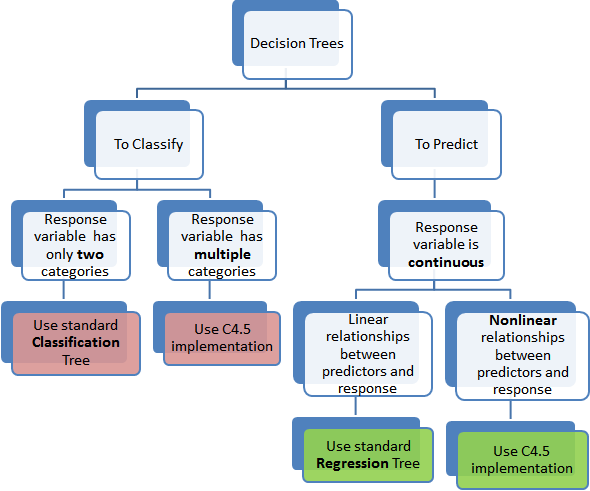
DECISION TREES
Classification and Regression Trees are commonly referred to as CART. The term was introduced by Leo Breiman to refer to Decision Tree algorithms that can be used for classification or regression predictive modelling problems.
The CART basic algorithm is the foundation for more advanced algorithms like bagged decision trees, random forest and boosted decision trees.
Decision trees are typically used to predict the probability of achieving an outcome for a new observation (individual, client, …) based on its attributes (age, demographics, purchase behaviour, …), by using previous data we have from a sufficient number of similar observations or individuals. The outcome to predict is normally binary: yes/ no (will churn/ won’t churn, will buy / won’t buy, …).
They are called trees because they can be represented as a binary tree where each root node represents a single input variable (age, city, segment…) and a split point on that variable (assuming the variable is numeric).
The leaf nodes of the tree contain the output variable (will buy, will churn, …) we want to predict. Let’s start with a simple example, where we will try to predict gender based on height and weight of people. Below is a very simple example of a binary decision tree:
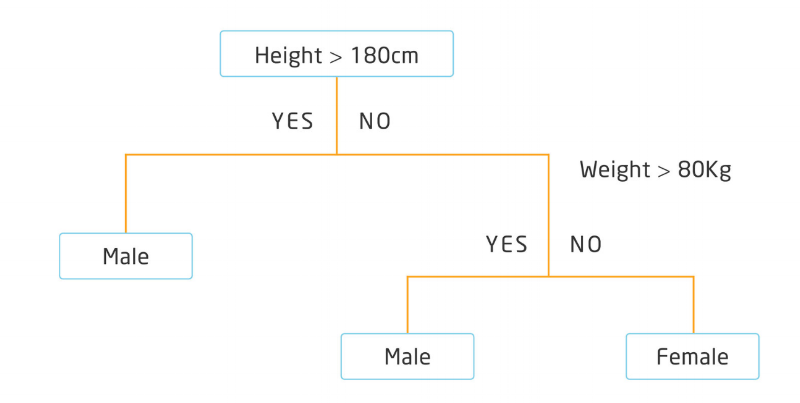
The tree can be represented both as a graph or as a set of rules. For example, below is the above decision tree, described a set of rules:
If Height > 180 cm Then Male
If Height <= 180 cm AND Weight > 80 kg Then Male
If Height <= 180 cm AND Weight <= 80 kg Then Female
With the binary tree representation of the CART model described above, making predictions is relatively straightforward. Whenever we evaluate a new individual, we can predict their gender based on height and weight, within a degree of confidence.
Decision trees are an easy method of representing frequencies of attributes we suspect can provide insights, helping to predict an outcome. They can be very useful to analyse probable causes of good and bad business outcomes, and help us improve our service levels, increase customer retention or prevent fraud, among many other applications.
Regression

Ex: Housing Prices Linear Regression
Use of labelled data to make predictions in a continuous form.
The output of the input is always ongoing, and the graph is linear.
Regression is a form of predictive modelling technique which investigates the relationship between a dependent variable[Outputs] and independent variable[Inputs].
This technique used for forecasting the weather, time series modelling, process optimization.
Linear Regression – relationship between two variables by fitting a linear equation to the observed data.
Ex: House Price Prediction, where the price of the house will predict from the inputs such as # of rooms, Locality, Ease of transport, Age of house, Area of a home.
How an increase in tax (for alcohol) has an influence for a number of cigarette packed consumed per day.
How sleep hours affect our grades in the courses.
To see correlation of experience for salaries.
Correlation between house floor are versus house price.
The second application is to forecast new observations (unobserved values).
Classification
It is the type of Supervised Learning in which labelled data is used to make predictions in a non-continuous form.
The output of the information is not always continuous, and the graph is non-linear.
In the classification technique, the algorithm learns from the data input given to it and then uses this learning to classify new observation.
This data set may merely be bi-class, or it may be multi-class too.
Ex: One of the examples of classification problems is to check whether the email is spam or not spam by train the algorithm for different spam words or emails. (K-Nearest Neighbours, SVM, Kernel, Naïve Bayes, Decision Tree, Random Forest)
Classification trees are used to separate the dataset into classes belonging to the response variable. Usually the response variable has two classes: Yes or No (1 or 0).
Regression trees are needed when the response variable is numeric or continuous. For example, the predicted price of a consumer good. Thus regression trees are applicable for prediction type of problems as opposed to classification.
Examples
If you want to predict whether a person will click on an online advertisement

In comparison, the Random Forest algorithm randomly selects observations and features to build several decision trees and then averages the results.
In the healthcare domain it is used to identify the correct combination of components in medicine and to analyse a patient’s medical history to identify diseases. In E-commerce random forest is used to determine whether a customer will actually like the product or not.
Understanding why customers leave
“It costs a lot less to keep an existing customer than to gain a new customer”
The mobile provider needs to be able to look at patterns from data as well as anomalies. The mobile provider has the benefit of having access to huge volumes of data across many different customers. By using the right algorithm, the vendor can create a model that maps the types of offerings and promotions that will retain customers and add new ones.
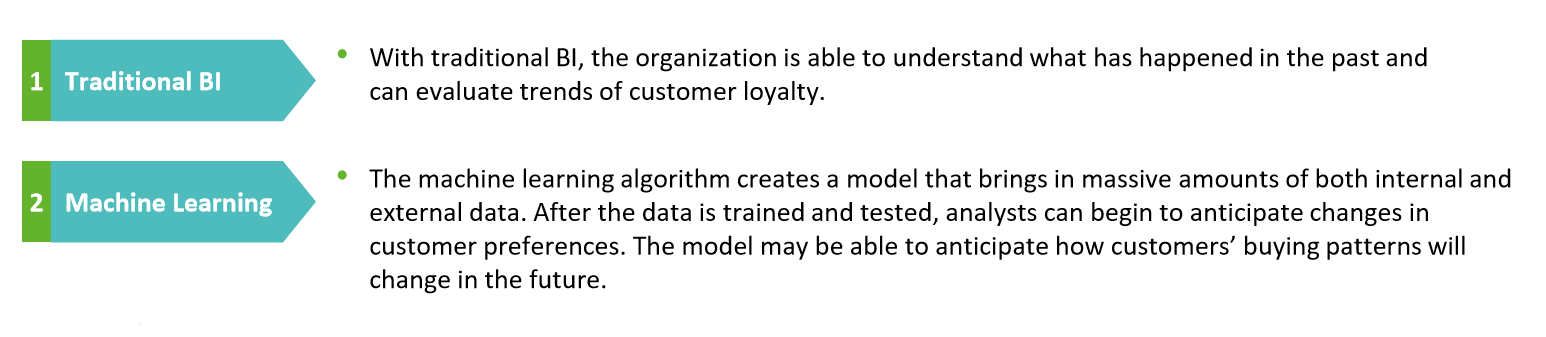
How much will it cost to retain and add new customers? Will new plans reduce revenue significantly? Will the spending justify the efforts? These are the types of predictions that a machine learning technique can provide. What is the difference between a traditional BI approach and a machine learning approach to customer churn?
Preventing accidents from happening
Industries such as manufacturing, oil and gas, and utilities succeed or fail based on their ability to prevent accidents. While it is common to have a maintenance schedule, that is often not enough.
For example, there may be a failure of a heating or air conditioning system. There could be a dramatic shift in weather conditions that could impact machinery.
Machine learning algorithms can be applied to preventive maintenance in a number of ways. For example, a regression algorithm can be used as the foundation for a model that can predict time to failure of a machine. Various classification algorithms can be used to model the patterns associated with machine failures. Data generated by sensors provides a huge volume of semi-structured data that can model and compare patterns of performance so that an anomaly from normal performance can be detected.
Unsupervised Learning
Unlabeled data are used to train the algorithm, which means it used against data that has no historical labels.
The purpose is to explore the data and find some structure within.

Ex: It can identify segments of customers with similar attributes who can then be treated similarly in marketing campaigns.
Or it can find the main attributes that separate customer segments from each other.
Popular techniques include self-organizing maps, nearest-neighbormapping, k-means clustering and singular value decomposition. These algorithms are also used to segment text topics, recommend items and identify data outliers.
Clustering
Cluster analysis or clustering is the task of grouping a set of objects in such a way that objects in the same group (called a cluster) are more similar (in some sense) to each other than to those in other groups (clusters).
Customer clustering uses purchase transaction data to track buying behavior and then create new business initiatives based upon findings.
The typical marketing goal is to emphasize and retain low-risk, high-value and high-profit customers – this “premium” cluster representing 10-20 percent of total buyers often produces 50-80 percent of a company’s profit.
Once this cluster is identified, you should consider up-selling and cross-selling techniques that will further contribute to the profitability potential of this attractive data cluster.
Decision trees are sometimes used for marketing campaigns.
You may want to predict the outcome of sending customers and prospects a 20 percent coupon.
You can break customers into four segments:
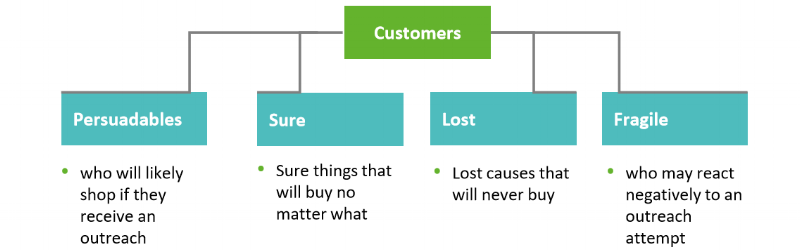
! Targeting the persuadables will give you the best return on investment (ROI). A decision tree will help you map out these four customer groups and organize prospects and customers based on who will react best to the marketing campaign.
Dimensionality reduction
Dimensionality reduction helps systems remove data that’s not useful for analysis.
This group of algorithms is used to remove redundant data, outliers, and other non-useful data.

Dimensionality reduction can be helpful when analyzing data from sensors and other Internet of Things (IoT) use cases. In IoT systems, there might be thousands of data points simply telling you that a sensor is turned on. Storing and analyzing that “on” data is not helpful and will occupy important storage space. In addition, by removing this redundant data, the performance of a machine learning system will improve.
Finally, dimensionality reduction will also help analysts visualize the data.
REINFORCEMENT MACHINE LEARNING
Reinforcement learning is often used for robotics, gaming and navigation.
With reinforcement learning, the algorithm discovers through trial and error which actions yield the greatest rewards.
This type of learning has three primary components: the agent (the learner or decision maker), the environment (everything the agent interacts with) and actions (what the agent can do).

Deep Learning | Neural Networks
Deep learning — complex neural networks — are designed to emulate how the human brain works so computers can be trained to deal with abstractions and problems that are poorly defined.
Neural networks and deep learning are often used in image recognition, speech, and computer vision applications.

Face Detection

Speech Recognition

SUMMARY
Machine Learning example cases
Manufacturing Industry
Anomaly detection in Steel manufacturing plants: oversee the production process
Quality checkup in automobile industry: monitor the assembly process
Inventory Management: estimate the condition of the inventory
Retail
Reengage Lagging Customers: predict which customer is unlikely to return
Boost Average Order Size: make smarter recommendations
Reduce Marketing Waste: to learn which products receive the best consumer response and adapt marketing tactics
Marketing and Sales
Lifetime Value: predictions about most budding customers early and target sales effort toward them
Churn: predictions who is leaving, refocus and personalize the deal
Sentiment analysis: NLP analytics on customer feedback
Security
Spam Filtering
Fraud Detection: blocking potentially fraudulent customers/ money transactions