
Optimizing the customer experience with better resource allocation is often a critical objective for businesses or governmental agencies. The following case study concerns the Emergency Services Contact Center of a large European metropolitan city. Their objective was to accurately predict the volume of inbound calls to be able to improve agent rostering and ensure optimal response times for callers in serious need of assistance.
The solution had to offer high reliability thresholds, as it would be fatal if there were peaks where the supply of operators (police, fire, ambulance, etc.) could not meet the demand for incoming calls.
In this article, we will describe the solution used to achieve this purpose, based on real examples applied to the use case. This will provide us with a complete view of the entire flow that Clariba followed to produce reliable predictions that would underpin the correct allocation of emergency service resources.
We’ll finish with a link to our explanatory Data Capsule for this use case, a short instructional video which collates the key points from this case study, and gives an overview of the whole process over a few minutes of viewing time.
1. Introduction to Dataiku
Imagine a place where you can perform all your data related work—such as cleaning, wrangling, visualization, prediction, and statistics—and blend it with various kinds of automation options within a click driven environment, plus add your own custom code recipes on top.
That’s basically what Dataiku is. But rather than try to discuss the whole platform, let’s start by diving into the user experience and take things step by step. First of all, here’s the start screen for a typical project:
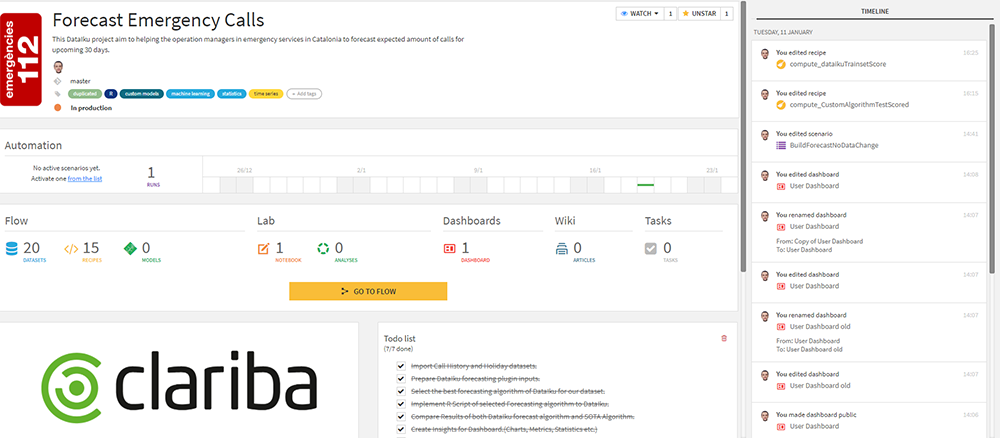
Fig. 1 Initial Screen
It’s a neat, comprehensive layout where you can edit task lists, assign project tags, review the latest successful or failed runs, see who has worked on the project and what have they done recently, and navigate directly into datasets, recipes, dashboards and the flow.
Implementing your data into Dataiku can be done in a few clicks (if you have the appropriate credentials) with various widely used database choices such as:
Amazon Redshift
SAP HANA
Snowflake
Google Cloud Storage
Amazon S3
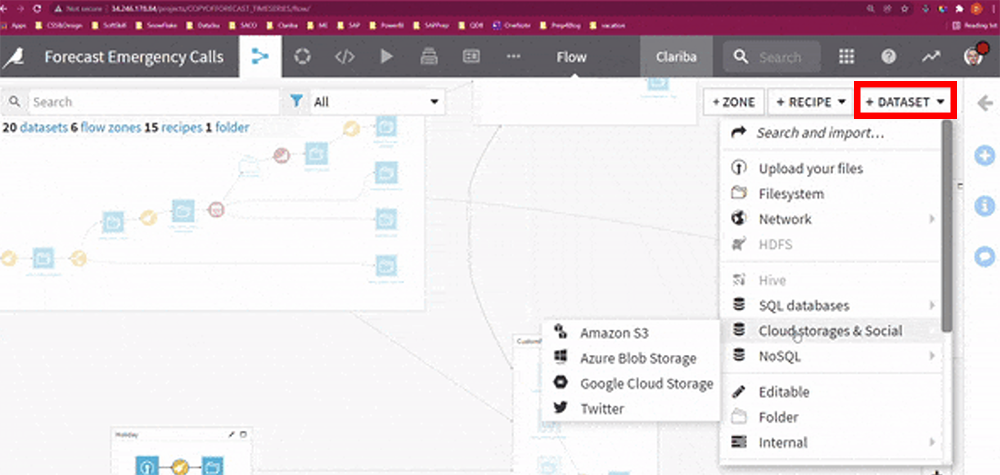
Fig. 2 Adding datasets
1.1. Recipes
Recipes are a set of predefined elements, included by default in the Dataiku installation, that allow you to perform a wide variety of standard operations to transform data (formulas, split, join, group, stack (union), filters with multiple conditions, etc.).
Thanks to the graphical interface, they are easily configurable—saving you from developing endless lines of code. It is simply no longer necessary to implement complex code to pivot data or apply complex rules to clean data. Now all these elements can be controlled within a single visual interface to streamline the workflow.
In addition, there is room for customization and advanced recipe creation. Dataiku allows you to reuse your own code (Python, R, etc.) and turn it into a customized, reusable, and flexible recipe. This will radically transform the way you work by introducing custom code into the data ingestion and transformation flow.
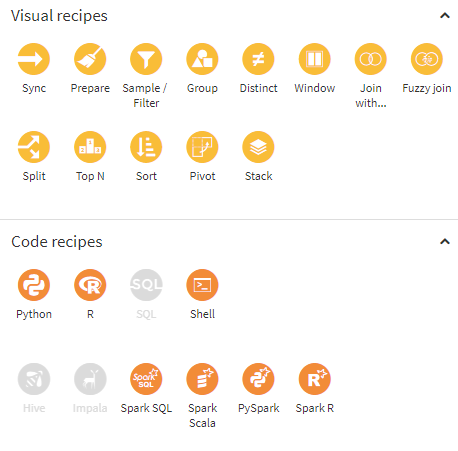
Fig. 3 Example recipes
1.2. Scenarios
Scenarios allow you to automate all your data set building, scenario checking, SQL/Python executing, metrics computing and related jobs to run following customized conditions for your clients and teammates. They make it easy to let everyone know the status of your scenario before or after the run.
There are many integration possibilities—you can chain the reporting and notification options to share information via email or your favorite communication platforms (Microsoft Teams, Slack, and so on).
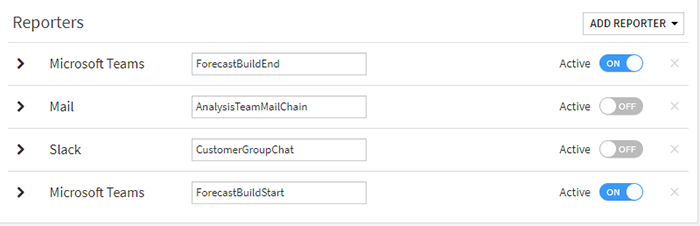
Fig. 4 Reporter options
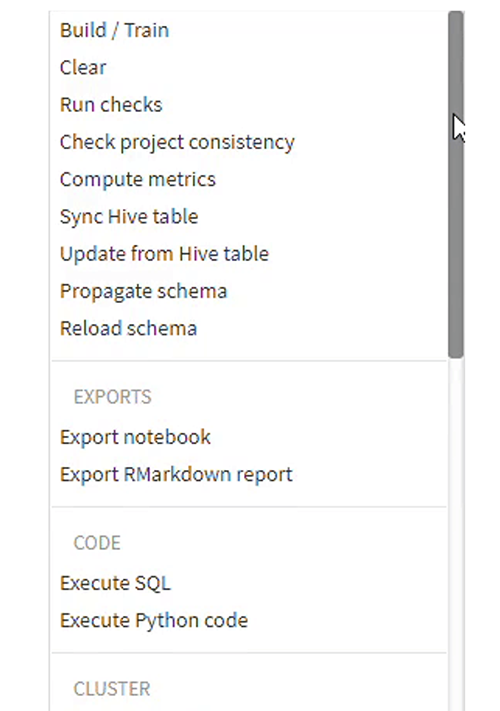
Fig. 5 Scenario options
In our original use case, before and after every execution of the forecasting process, a notification layer was triggered and all the interested stakeholders received custom alerts via Teams, indicating whether the new forecasting was ready to review.
1.3. Insights
When our data has gone through all the processes of transformation, accommodation, enrichment, and the outputs are ready to be displayed, Insights are very useful. In essence, they are a collection of elements that allow interaction with back-end flows (launching tasks), displaying tables, interactive charts or Notebooks, embedding web applications (Shiny for example) and much more. The following screenshot shows the currently available Insights for every Dataiku project.
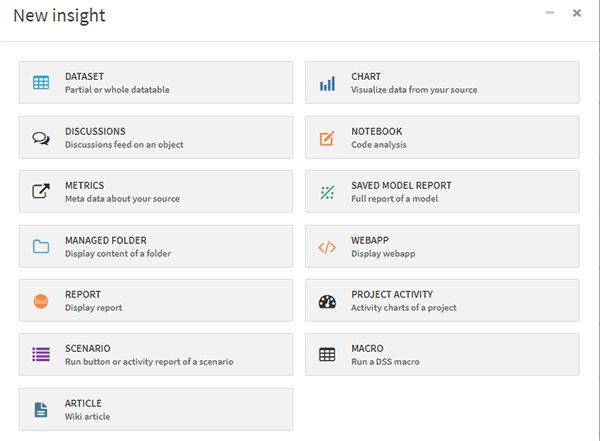
Fig. 6 Insight options
2. Available data, forecasting process and results
Now that we have introduced some of the main functionalities of the tool, we must understand the input data that will feed the whole predictive process. It is important to keep in mind that we will have to classify the multiple sources of information that the algorithm will consume, according to how they intervene in the model. Therefore, we can distinguish between:
Effective data: these correspond to the observations that are extracted directly from the DWH, i.e., the number of calls that occur for specific periods to be studied (volume of calls per day, per hour, etc.). For this use case, the range of data to be considered extends to multiple years, with a daily and hourly level of granularity.
Holidays and special dates: the model is enriched with elements that allow modifying the standard prediction based on effects known to humans.
Regressors: additional information to enrich the model. This makes it possible to capture the effect on the model of certain behaviors, such as weather, traffic, and other recurring events.
Using the integrated Workflow area, all these elements get arranged and processed. So, after preparing gathered calls and holidays data and splitting them into evaluate and train datasets, we have separated them into two different blocks called Dataiku Forecast and Custom Algorithm.
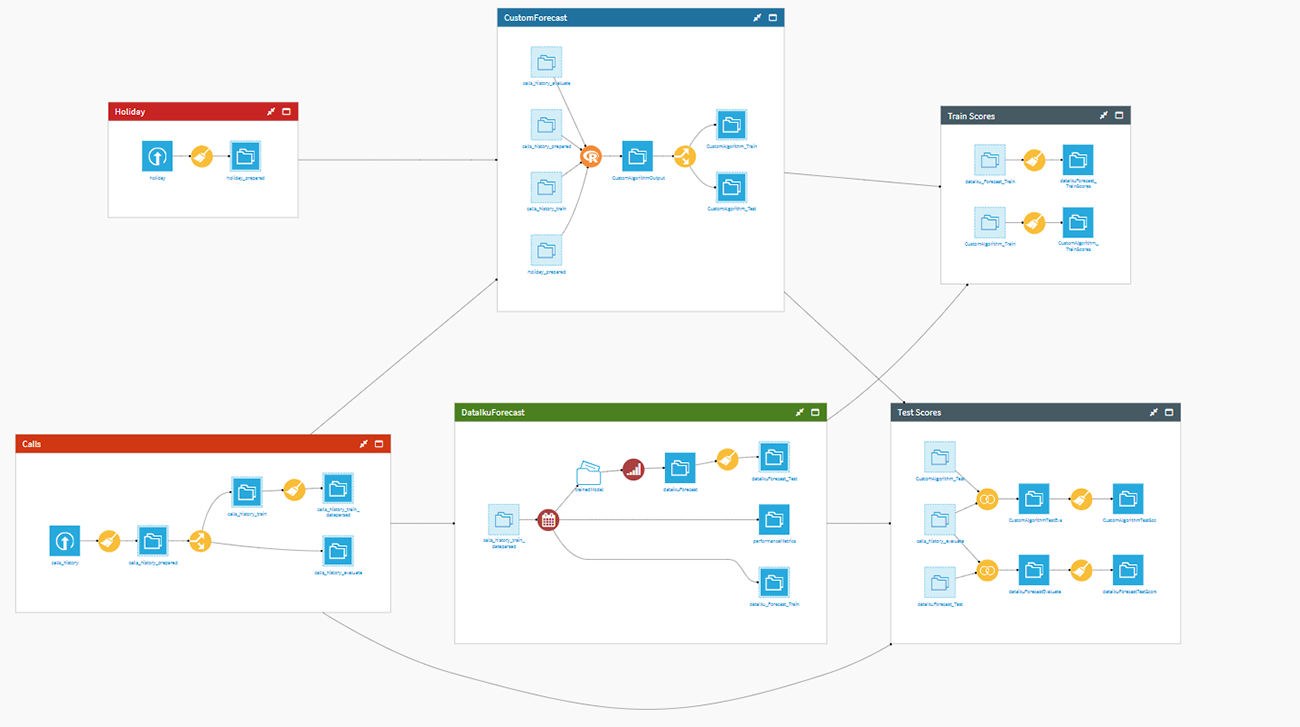
Fig. 7 Partner Capsule flow
2.1 Forecasting with Dataiku
Dataiku makes it easy to achieve both an accurate forecasting model and simple implementation steps. All we need to do is answer the following questions:
Which column contains our timeline?
What is the frequency?
Which column contains our target?
How many days ahead would you like to forecast?
Then simply load the forecast plugin recipe via the following quick steps:
Choose the model which suits your data best.
Set the confidence interval percentage to eliminate the worst results.
This plugin will take care of many underlying considerations and as a result two blocks will be produced, containing the train and test scores. These will be useful when evaluating the performance of the model and determining what kind of adjustments would be necessary to improve the confidence of the predictions.
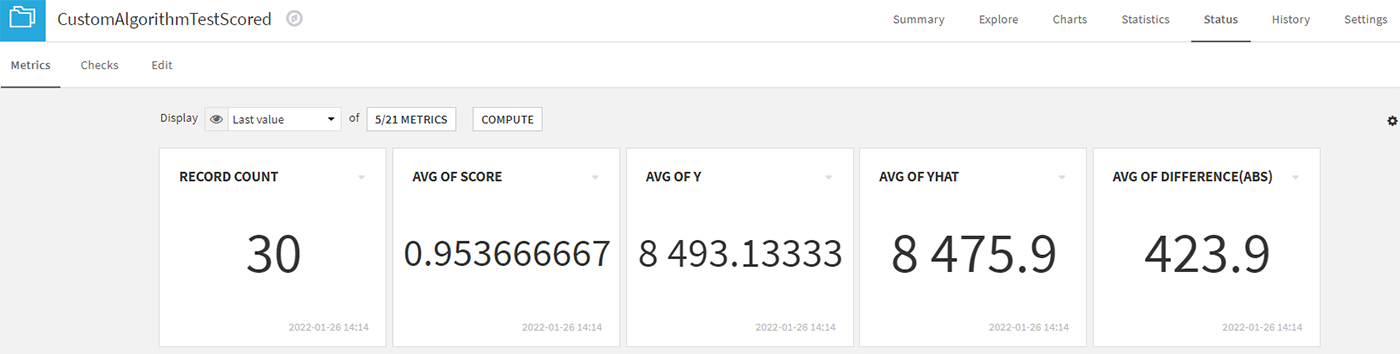
Fig. 8 Metrics menu achieved for custom algorithm
As we will see shortly, Dataiku's standard capabilities are excellent in this area, obtaining predictions that are really close to reality. However, the tool provides complete flexibility to the user, so that more sophisticated or customized code can be incorporated into the base process. In the next section we will give an example of this.
2.2. Custom algorithms in Dataiku
We mentioned in the previous section the possibility of including custom code to improve the (already good) predictions. In this case, we opted to implement the Prophet predictive algorithm to make a comparison with the original results provided by Dataiku and its integrated module.
Prophet was released by Sean J. Taylor and Ben Letham from Facebook in 2017 to forecast data with time series and its implementation is available on both Python and R. The method used here is called additive modeling and it discovers combinations of patterns at different time periods (daily, seasonally, yearly, etc.). When the algorithm's code was made open source, its creators pointed out:
“Prophet has been a key piece to improving Facebook’s ability to create a large number of trustworthy forecasts used for decision-making and even in product features.” ”
You might think such an implementation in Dataiku would require significant effort to adapt the dependencies and other particularities to this platform—however, nothing could be further from the truth. Thanks to the use of recipes, we can easily accommodate the additional code and turn it into another component of the workflow within Dataiku.
Now we can run the recipe with manual clicks, or we can include the run part in an automated scenario to get up-to-date results even after the input data has changed.
2.3. Results comparison: default forecasting plugin vs custom implementation
Now that both models have been deployed and adjusted, it is time to select which Insights will be part of the final dashboard—this will allow us to visualize and share the results with the team in charge of allocating emergency service resources.
Figure 6 above shows the available elements. For this dashboard we will make use of a varied assortment of elements: a web application, interactive graphics, static key indicators and even a control to launch the whole predictive process from the final dashboard. The result is shown below.
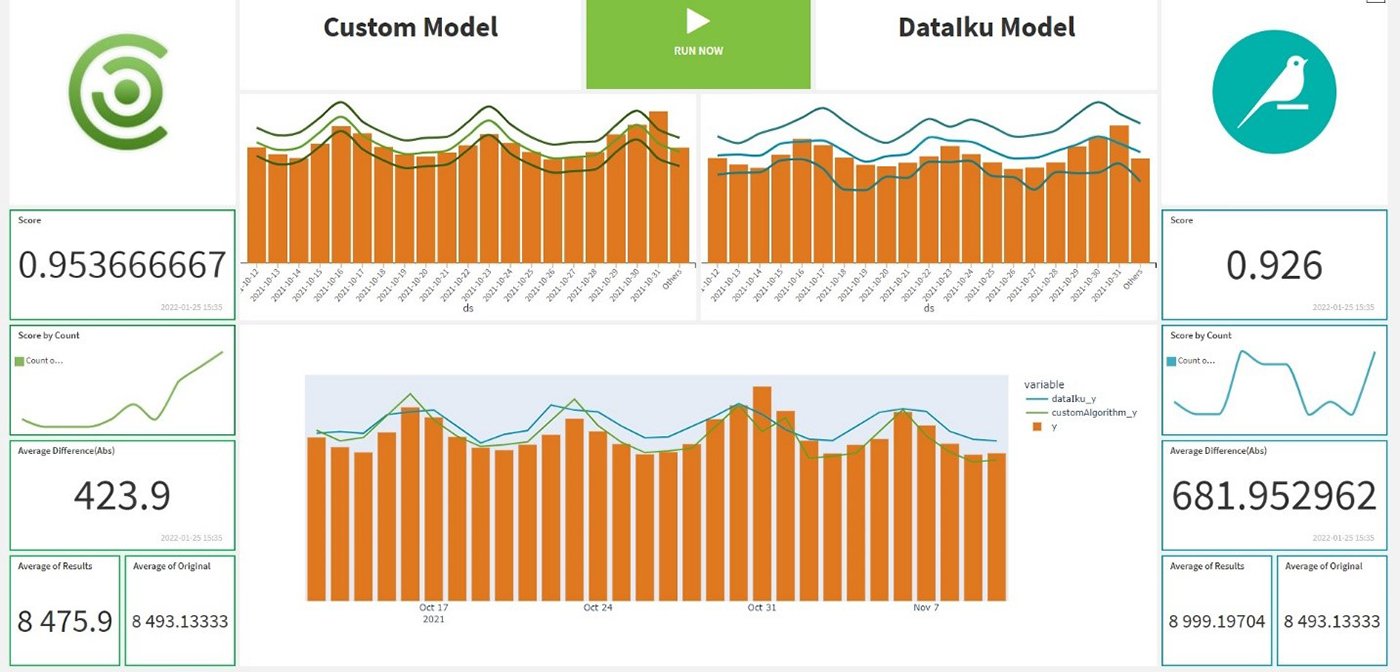
Fig. 9 Partner Capsule dashboard
The arrangement of the elements in the custom layout allows us to clearly appreciate the differences in the predictions of the two models. We can see that both exceed 0.9, which indicates that both have been able to predict for each day the number of incoming calls with more than 90% accuracy. Furthermore, the graphical capabilities of Dataiku allow us to customize the output due to the variety of charts available. Here we can observe an alternative representation of the results achieved:
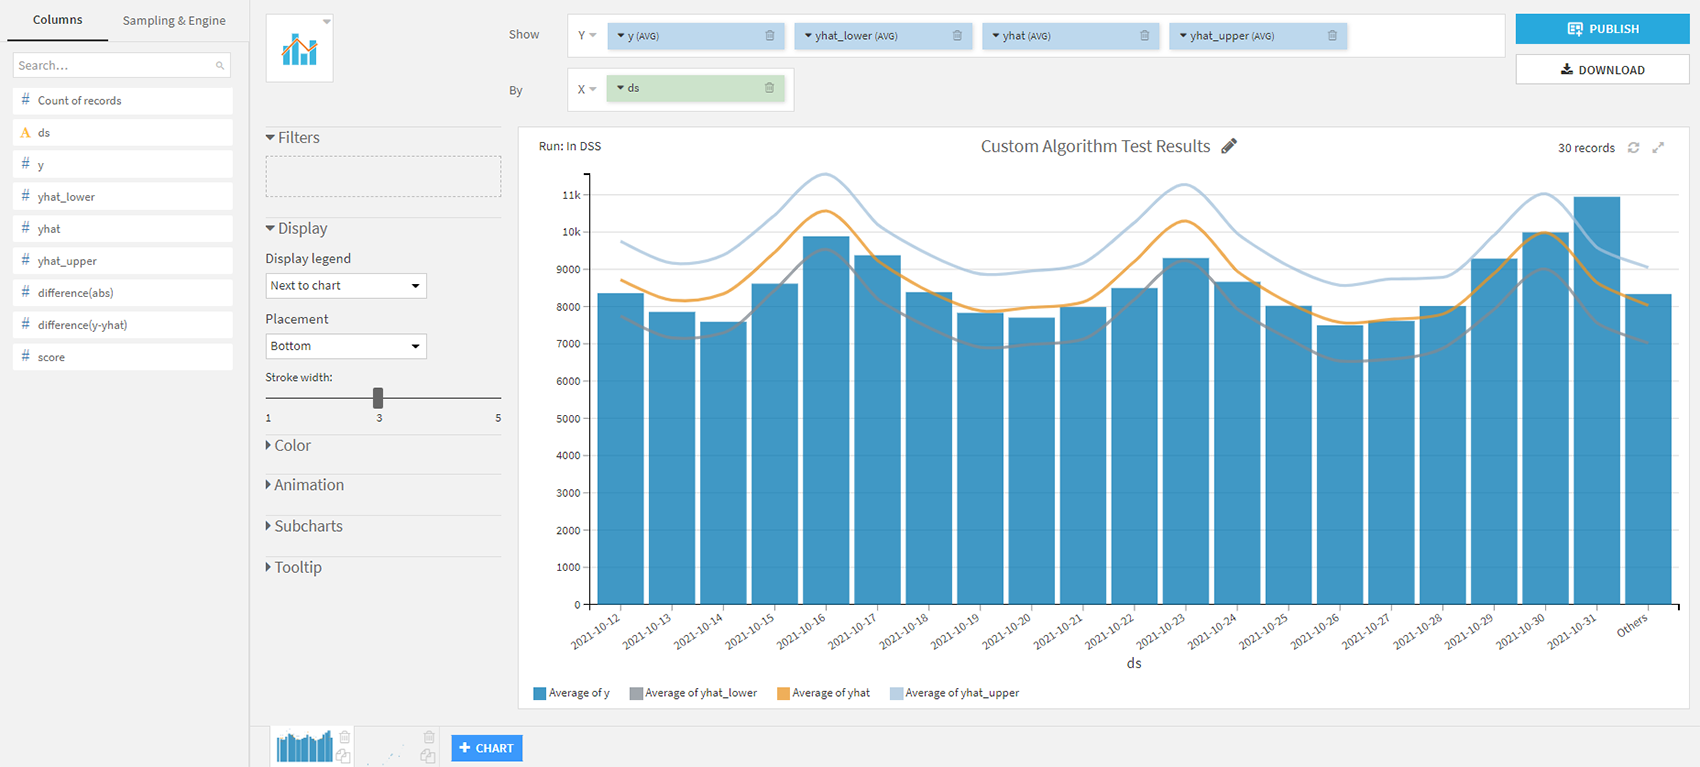
Fig. 10 Alternative chart with predicted results
As we can see, the customized model was able to outperform the basic implementation by about 3 points. The conclusion is clear: with just a few clicks, we can obtain great results from this tool, with solid predictions (>92%). Of course, if we want to go further, Dataiku gives us the facility to implement our code and improve—to an even greater degree—the outputs produced.
For a clear understanding of the scenario, check out our Data Capsule video below, which covers the process from start to finish:
3. Summary
We have presented a real-world use case showing how predictive algorithms can add significant value to business processes. Thanks to the deployment of the Dataiku platform and the custom development of an ML model, we were able to accelerate the implementation times of the solution while at the same time offering very high levels of confidence in the predictions.
The custom dashboard we created is now available to the operations team—giving them a reliable source of information to correctly assess the number of agents that must be available each day to respond to emergencies that may occur.
You can discover other use cases where our data experts have implemented successful solutions here:
Introduction to Digital Twins and its applicability in the world of logistics with Frit Ravich
Clariba Innovation Success Story: Automation of quality control processes at Almirall
As an expert Dataiku partner, Clariba is happy to offer you our experience to carry out any project you may have in the field of innovation and advanced analytics. To discuss a project—or if you have further questions about the case study above, please set up a meeting with one of our expert advisors here.